5 Smart Air Quality Monitors You Can Trust
We think about Smart Air Quality Monitors, water quality—even screen time quality. But the air filling our lungs, hour after hour, usually gets ignored because we can’t see it. Here’s the truth: indoor air can quietly accumulate dust, smoke, chemical fumes, CO2 from people breathing in a closed room, and moisture that feeds mold. If you’ve ever woken up groggy, battled stubborn allergies, or noticed a “stuffy” feeling after a long day indoors, Smart Air Quality Monitors may be the missing piece.
A smart air quality monitor changes that. It continuously measures what you can’t see—fine particles, gases, humidity—and sends real‑time alerts to your phone. When the air gets bad, you know. When you open a window, run a purifier, or switch to safer cleaners, you can see the difference in the data. That feedback loop turns good intentions into real, healthy change.
This in‑depth guide (no product buying list, just education) shows you exactly how Smart Air Quality Monitors work, what they measure, why indoor air quality matters, and how to act on the data to create a cleaner, safer home.
What Is a Smart Air Quality Monitor?
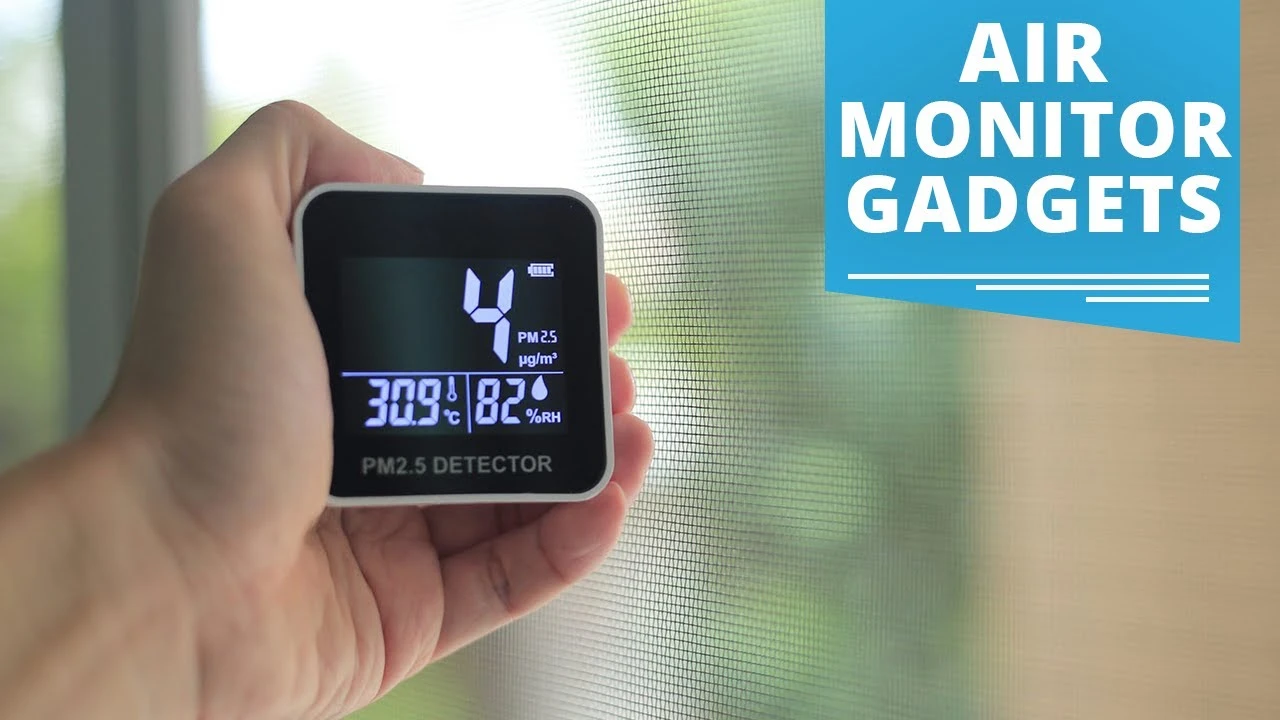
A smart air quality monitor is an electronic device that constantly samples the air around it and reports key readings—like PM2.5, VOCs, CO2, humidity, and temperature—to a display or companion mobile app. The “smart” part means it’s connected: Wi‑Fi, Bluetooth, or smart home integration lets you track trends over time and receive alerts when air quality falls below your preferred level.
Some monitors also integrate with smart home systems so you can trigger actions: turn on an air purifier, start a ventilation fan, crack a smart window opener, or send a notification to your phone when CO2 rises during a long study session. Think of it as a fitness tracker for your air: instead of counting steps, it tracks what you breathe.
Why Indoor Air Quality Matters (More Than You Think)
We spend most of our lives indoors—homes, offices, schools, transit, gyms. Indoor environments trap what we create: smoke from cooking, gases from new furniture or paint, dander from pets, dust from textiles, and carbon dioxide from breathing in sealed rooms. Humid climates add another layer: moisture feeds mold spores that affect breathing and allergies.
Common indoor triggers that degrade air quality include:
- Frying, grilling, and high‑heat cooking (fine particles + grease aerosols).
- Strong cleaning sprays, polish, and scented air fresheners (VOCs).
- Unventilated gathering spaces (CO2 buildup = “stuffy room” headaches).
- Damp basements or monsoon moisture (mold risk, musty odors).
- Burning candles, incense, or wood (particle pollution + soot).
- Poorly maintained HVAC filters (dust recirculation).
Without measurement, these exposures blend into daily life. With a indoor smart air quality monitor, you can see spikes, find sources, and make targeted improvements that protect health—especially for children, elders, and people with asthma or allergies.
What a Smart Air Quality Monitor Measures
Different devices measure different pollutants. Understanding the main categories helps you read your data with confidence.
PM2.5 (Fine Particulate Matter)
Particles 2.5 micrometers or smaller are tiny enough to reach deep into the lungs. Common indoor sources: cooking smoke, candles, wood stoves, smoking, and outdoor pollution leaking in. High readings after frying food are normal—but if they stay high, you need better ventilation or filtration.
PM10 (Coarse Particles)
Larger inhalable particles: dust, pollen, pet hair fragments. Useful if you have seasonal allergies or live in a dusty region.
VOCs (Volatile Organic Compounds)
A wide class of airborne chemicals released from cleaning sprays, solvents, paints, glues, flooring, new furniture, aerosol deodorants, nail polish products, and air fresheners. Many monitors show tVOC (total VOC level) rather than individual chemicals. Use it to see when chemical fumes linger—and to test whether switching to low‑VOC products helps.
Formaldehyde (HCHO)
A specific VOC found in pressed wood, resins, textiles, adhesives, and some building materials. Certain smart monitors track it directly; others include it within total VOC readings.
CO2 (Carbon Dioxide)
Exhaled by people and pets. Rising CO2 indoors usually means poor ventilation—not enough fresh air coming in. High CO2 is associated with drowsiness, headaches, and reduced cognitive performance in enclosed rooms like classrooms and offices.
Important: CO2 is not the same as CO (carbon monoxide). CO is a dangerous combustion gas and requires a dedicated safety alarm. A smart air quality monitor may or may not include CO sensing; always use certified alarms where required.
Humidity (%RH)
Humidity affects comfort and health. Too high (often above ~60–65%) encourages mold growth and dust mites. Too low (often below ~30%) dries airways, skin, and eyes. A monitor that tracks humidity helps you manage both dehumidifiers and humidifiers more intelligently.
Temperature
Not just comfort—temperature affects how people use spaces (open/close windows), how fast chemicals off‑gas, and how humidity behaves. Pairing temperature trends with pollutant spikes creates useful context.
The Hidden Life of Indoor Air: Where Pollution Comes From
Let’s connect common home activities with the numbers you’ll see:
Indoor Source
- Frying / high‑heat cooking
- Painting / new furniture
- Cleaning sprays & polish
- Crowded meeting / study room
- Humid basement / rainy season
- Burning candles / incense
Likely Pollutant Spike
- PM2.5, VOCs
- VOCs, sometimes formaldehyde
- VOCs
- CO2
- High humidity, mold risk
- PM2.5, soot, VOCs
Notes
- Use range hood + purifier.
- Ventilate for days/weeks.
- Switch to low‑odor or plant‑based when possible.
- Open windows or boost mechanical ventilation.
- Dehumidify + airflow.
- Use sparingly; ventilate.
Tracking these patterns teaches you what your home breathes.
Health Connections: What Poor Air Quality Does to the Body
You don’t need a medical degree to see the impact of air on well‑being. Many people notice:
Stuffy, heavy air → headaches or brain fog.
High dust load → sneezing, itchy eyes, allergy flare‑ups.
Damp, musty rooms → irritated throat, mold sensitivity.
CO2 buildup at night → poor sleep, morning fatigue.
Repeated smoke exposure → coughing, irritated airways.
Families with asthma, COPD, chemical sensitivity, autoimmune issues, or infants benefit especially from continuous monitoring. Even if readings aren’t “perfect,” simply knowing when air gets worse gives you control.
How Smart Air Quality Monitors Work
Here’s the journey from air to insight:
Air Intake: Air enters through vents or a tiny fan.
Sensing: Different internal sensors detect particles, gases, moisture, and temperature.
Laser/LED scattering counts particles (PM2.5/PM10).
Infrared or NDIR modules measure CO2.
Metal‑oxide or electrochemical sensors react to VOCs.
Signal Processing: Electrical signals become readings.
Calibration & Compensation: Software corrects for factors like humidity or sensor drift.
Connectivity: Data is sent via Wi‑Fi, Bluetooth, or a hub to your phone or cloud account.
Visualization: Apps show numbers, color bars, graphs, and historical trends.
Alerts & Automation: Notifications fire, or smart plugs activate purifiers based on your rules.
Some privacy‑friendly models store data locally; others rely on cloud platforms to log history and send alerts.
Understanding the Readings (Without Stressing Over Exact Numbers)
People often ask: “What number is good?” Because different devices scale things differently, focus first on direction and trend, not perfection.
Example Ways to Respond to Readings
PM2.5 climbs during cooking → Turn on range hood + air purifier.
CO2 rises above what’s typical for your home → Open a window, enable ventilation.
VOCs spike after cleaning → Ventilate; switch to milder products next time.
Humidity stays high → Use dehumidifier or AC; check for leaks.
If you want rough guideposts (not regulatory limits), many people start acting when PM2.5 moves from “low baseline” to clearly elevated for more than a few minutes—especially around children, elders, or asthma‑sensitive individuals.
Where to Place Your Smart Air Quality Monitor
Placement makes or breaks data quality. A poorly placed device can “panic” you over false spikes—or hide real problems.
Best Practices:
Set at breathing height (roughly 1–1.5 m / 3–5 ft).
Leave at least 30 cm / 1 ft clearance from walls or corners for airflow.
Keep away from direct HVAC vents, humidifiers, purifier outputs, and open flames.
Avoid direct sunlight that can heat the device and distort readings.
Use multiple monitors for multi‑floor homes or very large open spaces.
Good Locations: Bedroom nightstands (not right next to diffuser), living room shelves, home office desks, classroom shelves, near kitchen (but not right over the stove).
How Many Smart Air Quality Monitors Do You Need?
Start with one in the most lived‑in or most sensitive space: bedroom, nursery, or main living area. Log data for a week. If you see big spikes tied to specific rooms (kitchen, basement, workshop), add a second or third monitor later. Large homes or households with health concerns benefit from zoned monitoring.
Everyday Life Scenarios: Smart Air Quality Monitors in Action
Let’s walk through a real‑life day to show how your data turns into action.
Morning Cooking: You fry parathas or eggs. Within minutes PM2.5 climbs. Your phone alert: “Particles rising in kitchen.” You flip the range hood to high. After 10 minutes the readings drop—proof your ventilation works.
Afternoon Cleaning: You spray bathroom cleaner. VOCs spike. You crack a window and switch to a low‑odor product next time. Next cleaning day? The spike is smaller—data that your change mattered.
Evening Movie Night: Five people in a closed room = CO2 rising. You get a “stale air” notification at 950–1100 ppm. You open a window, the number drops, everyone feels more alert.
Rainy Season: Humidity stays high all week. Mold risk grows. You plug in a dehumidifier and set an automation: If humidity > 65%, turn it on. Your IAQ app shows stable levels within days.
These little cycles teach you how your space “breathes.” The monitor becomes an environmental coach.
Acting on Your Data: What to Do When Air Quality Drops
Collecting data is step one; responding is what improves health. Use these action categories:
Ventilation
Open windows, use cross‑breeze, or run exhaust fans to dilute CO2, VOCs, and stagnant air. In polluted cities, ventilate during cleaner outdoor hours (morning or after rain).
Filtration
Run HEPA air purifiers to reduce PM2.5, smoke, and dust. Place one near cooking areas, pet zones, or bedrooms with allergies.
Source Control
Switch to low‑VOC paints, fragrance‑free cleaners, gas‑tight lids on solvents, and closed storage for chemicals. Replace old or damp carpets that trap dust and mold.
Humidity Management
Use dehumidifiers in wet seasons or basements; humidifiers in dry winter climates. Always monitor with your Smart Air Quality Monitors device to avoid overshooting.
Behavior Changes
Use lids while cooking, run range hoods longer, limit indoor smoking or candle burning, groom pets regularly, change HVAC filters on schedule.
Smart Home Integration: Automation That Actually Helps
Once you’ve reviewed your baseline data, automation saves time.
Examples:
If PM2.5 > setpoint → Turn on air purifier smart plug.
If CO2 stays high for 10 min → Send push alert: “Ventilate living room.”
If humidity > 65% → Automatically start dehumidifier.
Use voice: “Alexa, what’s the indoor air quality?” or “Hey Google, is the air in the nursery okay?”
Advanced users can integrate via Home Assistant, Apple HomeKit, or Matter‑enabled devices for cross‑brand control. Start with one simple automation that solves a real problem, then expand.
Special Situations & Sensitive Groups
Different households have different priorities. Tailor alerts and thresholds.
Babies & Young Children
Nurseries often have new paint, adhesives, mattresses, and soft goods that off‑gas VOCs. Monitor VOCs + humidity closely; ventilate daily.
Asthma, Allergies, COPD
Lower your alert thresholds for PM and humidity. Track patterns: do symptoms spike after vacuuming or during pollen season?
Elderly Care
Older adults may not notice stale air; automated CO2 reminders help maintain ventilation in rooms that stay closed.
Pet Owners
Dander, fur, litter dust—all add to particulate load. Use a monitor near pet areas and pair with filtration.
Home Offices / Study Rooms
Closed doors + long hours = CO2 buildup. Schedule stretch & fresh‑air breaks when readings rise.
Multi‑Unit Apartments
Cooking smells and smoke can drift between units. Use monitors to detect infiltration and talk to building management about sealing gaps and improving ventilation.
Climate & Regional Air Challenges
Where you live changes what your Smart Air Quality Monitors reveals.
Urban Traffic & Smog
If your windows face a busy road, outdoor PM2.5 and NO₂ can spike during rush hours. Track indoor/outdoor differences to time ventilation when air is cleaner.
Dust Seasons
In arid or semi‑arid regions (or during construction), coarse dust (PM10) infiltrates easily. Seal gaps and use filtration.
Monsoon Humidity
Extended rainy periods raise indoor humidity and mold risk. Use your Smart Air Quality Monitors to guide dehumidifier use—especially in ground‑floor rooms.
Winter Heating
Closed windows trap VOCs and CO2 from heaters, cooking, and indoor crowding. Plan ventilation bursts or use mechanical fresh‑air systems.
Crop Burning / Wildfire Smoke
Seasonal burning can send PM2.5 through the roof outdoors. Use Smart Air Quality Monitors to decide when to keep windows closed and when to run portable HEPA units continuously.
Maintenance & Care: Keeping Your Smart Air Quality Monitor Reliable
Smart air quality monitors need light upkeep to stay accurate:
Dust the intake vents monthly with a soft brush or gentle air puffer.
Keep airflow clear—don’t block with books or curtains.
Firmware updates often improve accuracy and stability—check the app occasionally.
Calibrate/Reset CO2 baseline per manufacturer instructions (some auto‑calibrate when exposed to outdoor air periodically).
Check power stability—USB cables or adapters that disconnect cause data gaps.Confirm correct time zone (e.g., Asia/Karachi) so your historical graphs line up with real events.
Troubleshooting Common Issues
Symptom
- Sudden huge PM reading
- Readings flat or 0
- VOCs always high
- CO2 never drops
- Device offline
Possible Cause
- Cooking smoke, dust burst, placement near vent
- Sensor blocked or device fault
- Strong cleaners, paint, fragrance diffusers
- Room never ventilated; closed door at night
- Weak Wi‑Fi, 5 GHz only
Fix
- Move device; confirm with second reading.
- Clean vents; restart; check firmware.
- Ventilate; remove source; retest next day.
- Add ventilation cycle or open window crack.
- Use 2.4 GHz network if required; relocate router.
When in doubt, move the device outdoors for 10–15 minutes. If readings don’t change at all, the sensor may need service.
Myths vs Facts About Indoor Air & Smart Air Quality Monitors
Myth: “If I can’t smell anything, the air is fine.”
Fact: Many harmful pollutants (CO2, VOCs) are odorless.
Myth: “I have an air purifier, so I don’t need a monitor.”
Fact: A purifier cleans, but a monitor tells you when to run it—and whether it’s working.
Myth: “Outdoor air is always worse.”
Fact: Indoor air can become more polluted than outdoors if ventilation is poor.
Myth: “Once readings are good, I’m done.”
Fact: Air quality changes with seasons, activities, and building use. Keep monitoring.
Sustainability & Energy Considerations
Running fans and purifiers nonstop burns energy. A Smart Air Quality Monitors helps you target interventions:
Run purifiers only when PM spikes.
Ventilate during outdoor “clean air windows,” not during high‑pollution hours.
Control humidity efficiently—avoid over‑humidifying.
Use scheduled mode: nighttime low‑speed filtration + daytime boost only when needed.
Smart Air Quality Monitors and lower utility bills? Smart data makes it possible.
Safety Note: Smart Monitor ≠ Safety Alarm
A Smart Air Quality Monitors is a health and comfort tool—not a substitute for certified safety alarms:
Install smoke detectors as required by local code.
Install carbon monoxide (CO) alarms near combustion appliances or garages.
Use gas leak alarms if applicable.
If your Smart Air Quality Monitors includes CO or smoke detection, treat it as an extra layer—not your only layer.
FAQS
1. What does a smart air quality monitor actually measure?
Most measure fine particles (PM2.5), VOCs, CO2, humidity, and temperature. Some measure PM10, formaldehyde, or ozone depending on model.
2. How often does it sample the air?
Many sample every few seconds to minutes and update rolling averages in the app. Check device settings; some allow custom intervals to save power.
3. Can I use one Smart Air Quality Monitors for the whole house?
You can start with one, but large or multi‑floor homes benefit from additional units in bedrooms, kitchens, and basements.
4. Do I still need an air purifier?
Yes. The Smart Air Quality Monitors tells you when air is poor; the purifier reduces particles. They work best together.
5. Are smart air quality monitors accurate?
Consumer Smart Air Quality Monitors are good for trends and relative changes. Lab‑grade instruments are required for regulatory enforcement. Use your monitor to guide decisions, not to replace professional testing.
6. What’s a good CO2 level indoors?
Lower is better. When readings rise noticeably above your normal baseline (often around 800–1000 ppm in occupied rooms), ventilate.
7. Why do PM2.5 numbers spike when I cook?
High‑heat cooking releases micro‑aerosols and smoke. Use your range hood and keep purifiers running during and after cooking.
8. My VOC readings are high after moving into a new home—normal?
New paint, flooring, adhesives, and furniture off‑gas chemicals. Ventilate regularly; readings should decline over weeks.
9. Does humidity affect sensor readings?
Yes—very high humidity can interfere with some particle and gas sensors. If readings seem odd during humid weather, compare after dehumidifying.
10. Can I travel with a Smart Air Quality Monitors?
Portable battery units are perfect for hotel rooms, offices, coworking spaces, or short‑term rentals.
11. Will it work without Wi‑Fi?
Some show data locally on the device. Remote alerts, history, and app logging usually require connectivity.
12. How long do sensors last?
Varies by brand and environment. Many consumer devices function well for several years; some offer replaceable sensor modules.